Expense Tracker
A Flask web app to log spending, categorize it, and visualize trends with auto-generated bar and line charts.
I wanted the chart, not the spreadsheet ritual.
Tracking spending in a spreadsheet works right up until you want to see it. Then it's a pivot table, or a chart you rebuild by hand every time the range grows, or an export into something else. The data was never the hard part. Keeping the view of it current was.
So the target was narrow on purpose: type three fields, and get back a table and two charts computed from every row you have ever entered, with no build step, no account, and no database to stand up first.
What it had to do, and what it deliberately doesn't.
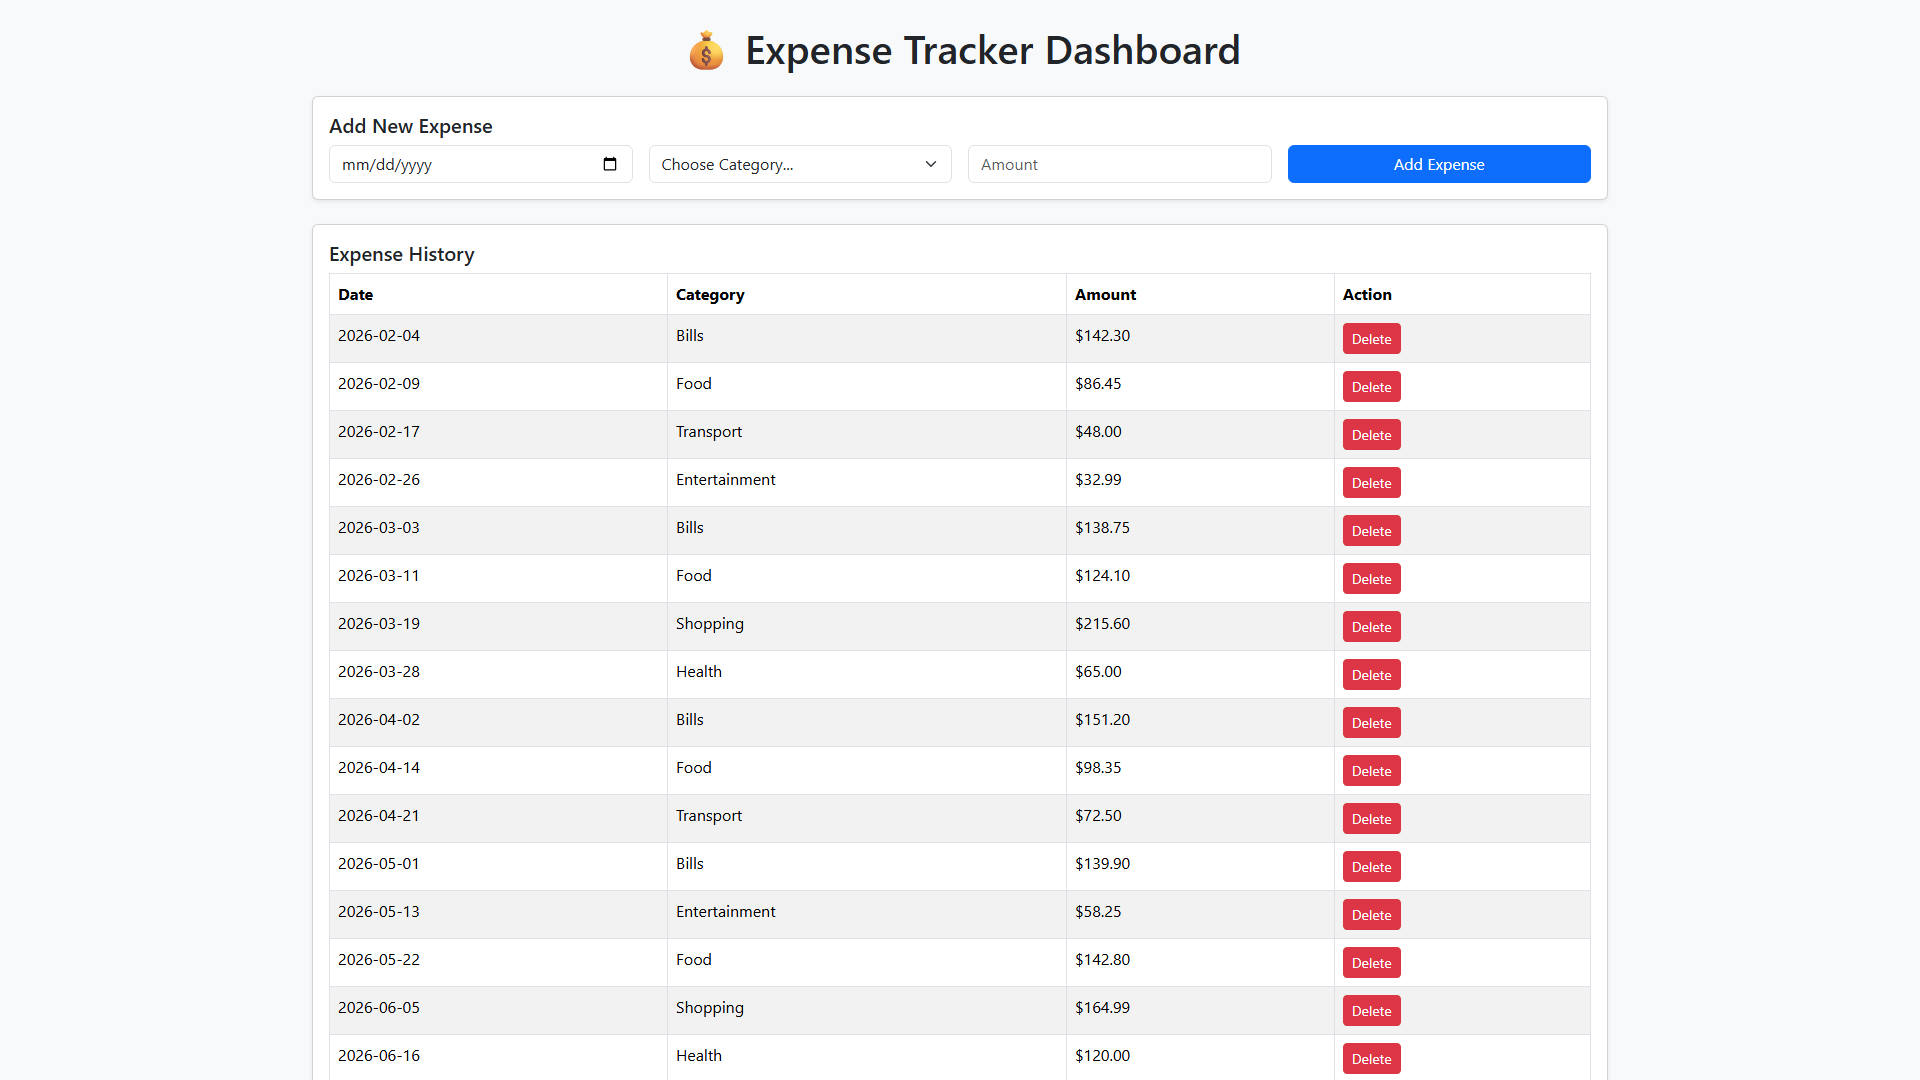
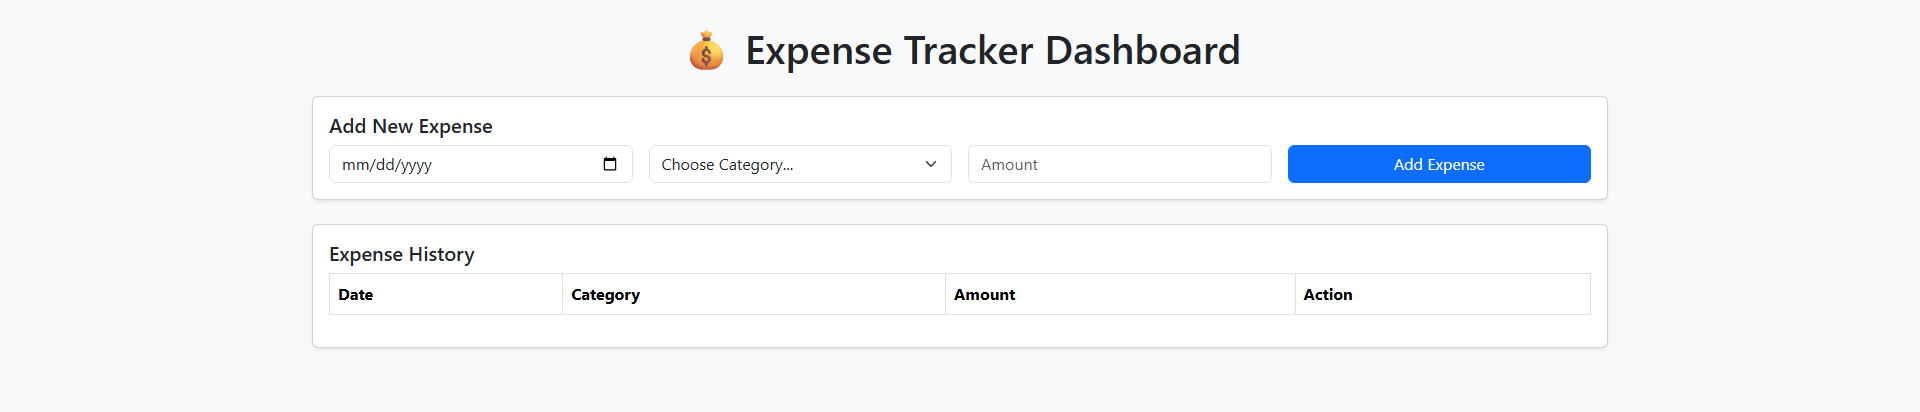
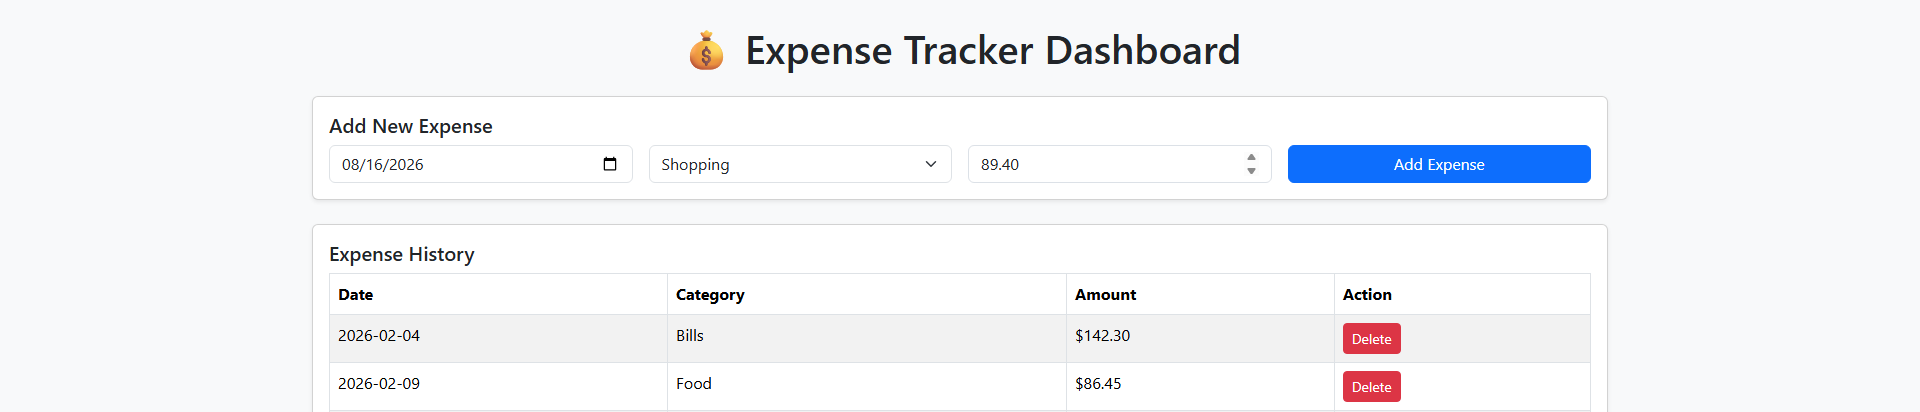
A date, one of seven categories, and an amount. The form is the only way data gets in, and every field is required. There is no import, no receipt parsing, and no recurring entries.
Every expense in one table, in insertion order, each row with a delete button. No paging, sorting, or filtering, because at a few hundred rows none of those earn their complexity.
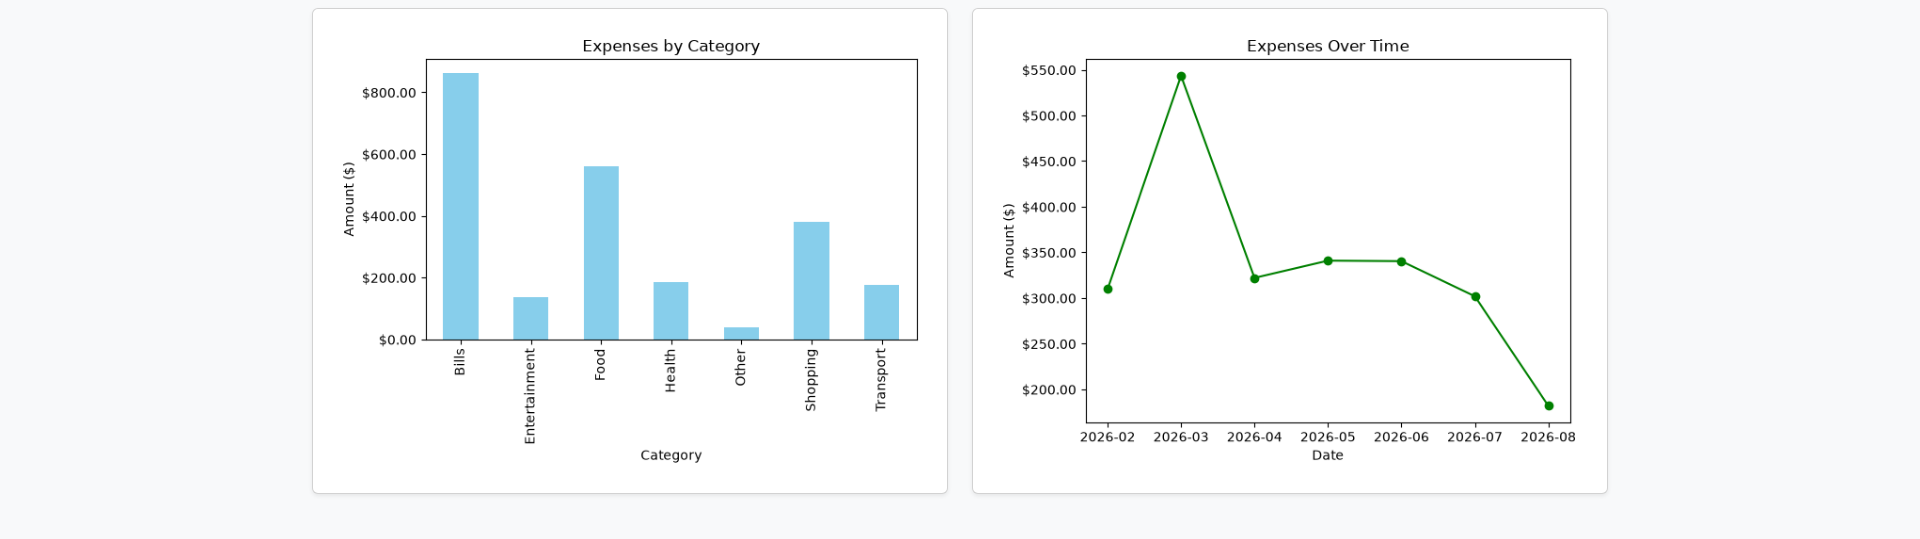
Two charts redrawn from the full dataset on every page load: totals per category as bars, totals per month as a line. Nothing is cached, so nothing can be stale.
Single-user and local by design: one Python file, one CSV, one flask run. There is no auth, and the app assumes exactly one person is using it at a time.
One file, one request cycle, one source of truth.
Every request reads the CSV into a pandas DataFrame, does its work, and writes the whole file back if anything changed. No state survives between requests, which means the file on disk is always the truth. You can edit it in a spreadsheet mid-session and the next page load reflects it.
The charts follow the same rule. Rather than storing generated images, plot_expenses groups the DataFrame, draws two matplotlib figures, writes them into an in-memory buffer, and hands back base64 strings that get inlined into the HTML as data URIs. Nothing touches a static directory, so there are no orphaned PNGs and no invalidation logic. The images cannot disagree with the data, because they are built from it on the spot.
Matplotlib defaults to a GUI backend, which falls over in a web process the moment a figure is created off the main thread. Setting matplotlib.use("Agg") is the one line that makes any of this work in a server at all, and it has to run before pyplot is imported rather than after.
What happens between the submit and the redraw.
The row is appended, the file is rewritten
The form posts to the same route that renders the page. The new row takes the highest existing ID plus one, gets concatenated onto the DataFrame, and the whole CSV is written back out.
Post/Redirect/Get, so a refresh is harmless
The POST answers with a redirect rather than HTML. Without it, refreshing after a submit would re-post the form and log the same expense a second time.
Read, group, draw, inline
The GET reloads the CSV, groups it two ways with pandas, renders both figures to PNG bytes in memory, and base64-inlines them into one HTML response carrying the table and both charts.
Choices behind a deliberately small app.
What I chose, and what it cost.
Regenerating both charts on every request
CostTwo matplotlib figures are drawn, encoded, and thrown away on every page load, including loads that changed nothing. Imperceptible at a few hundred rows, and the wrong shape at a few hundred thousand. The fix is to cache against a hash of the data, which this doesn't do because it has never needed to.
Delete as a GET link with a JavaScript confirm
CostIt's one anchor tag and one onclick, which is why it exists in that form, but a GET that mutates state is a real bug rather than a shortcut. Anything that fetches links on the user's behalf could remove a row without a click, and the confirm is browser-side only. It should be a POST with a form button.
Rewriting the whole CSV on every mutation
CostTwo writes racing each other lose data, and a crash mid-write truncates the file with no backup. For one person on localhost that risk never fires; it is also exactly what makes a CSV the wrong answer the moment a second user exists.
Where I'd take it.
Move deletes to a POST, and add an edit path. A mistyped amount currently has to be deleted and re-entered, and the delete itself is a GET. Both are the same fix: treat mutations as form submissions.
A date-range filter driving both the table and the charts. Every view is all-time right now, which is the least useful window for the question the app exists to answer.
Swap the CSV for SQLite behind the same two functions. load_data and save_data are the only places that touch storage, so the change stays contained, and it buys real types, atomic writes, and room for more than one user.